AI for Data Analysis: Use AI to Explore a Spreadsheet Safely
A step-by-step way to use AI tools to explore a spreadsheet: prepare and anonymise the data, ask focused questions, verify results and avoid common traps.
You’ve got a spreadsheet with thousands of rows and a manager asking “so what does it tell us?” AI tools can help you find an answer faster: they can describe patterns, suggest formulas, draft charts and explain results in plain English. But they can also misread columns, invent trends and expose data you should have kept private.
This guide shows how to use AI for data analysis in a way that’s both useful and safe. You’ll learn how to prepare a spreadsheet, what to ask, how to check every answer, and how to turn findings into something people can act on.
Quick answer: To explore a spreadsheet safely with AI, first clean it and remove or replace personal and confidential details. Share only the columns you need, describe what each column means, and ask focused questions. Then verify every important number with your own PivotTable or formula, ask the AI to show its steps, and treat its explanations as ideas to test, not conclusions.
What AI can and can’t do with a spreadsheet
AI tools like Claude can be a capable assistant for spreadsheet work. Depending on the tool and its features, they can:
- Describe the structure of your data and spot obvious issues, such as blanks or mixed formats
- Suggest Excel formulas and explain how they work
- Summarise patterns, such as which categories are growing or shrinking
- Recommend chart types and draft chart titles
- Write Python or other code to analyse the data, in tools that support it
What they can’t do reliably:
- Know the business context behind your numbers unless you explain it
- Get every calculation right every time, especially in long conversations or large files
- Tell correlation from cause
- Spot that a column is mislabelled or that data is missing for a whole month, unless you ask
The safest mindset: AI is a fast junior analyst whose work you always review.
Step 1: Prepare and clean the data
AI works best on tidy data, and so do you. Before involving any tool:
- Put the data in a single table with one header row.
- Remove blank rows, totals rows and merged cells.
- Make sure each column holds one type of data: dates, numbers or text.
- Fix obvious inconsistencies, such as “Kolkata”, “kolkata” and “KOL” in the same column.
Our data cleaning checklist walks through this in detail. Clean data means fewer AI mistakes and answers you can trust more.
Step 2: Protect privacy before you share anything
This is the step people skip, and it matters most.
Remove what you don’t need
Delete columns that aren’t required for the question. If you’re analysing sales by region, you don’t need customer names, phone numbers or email addresses.
Replace identifiers
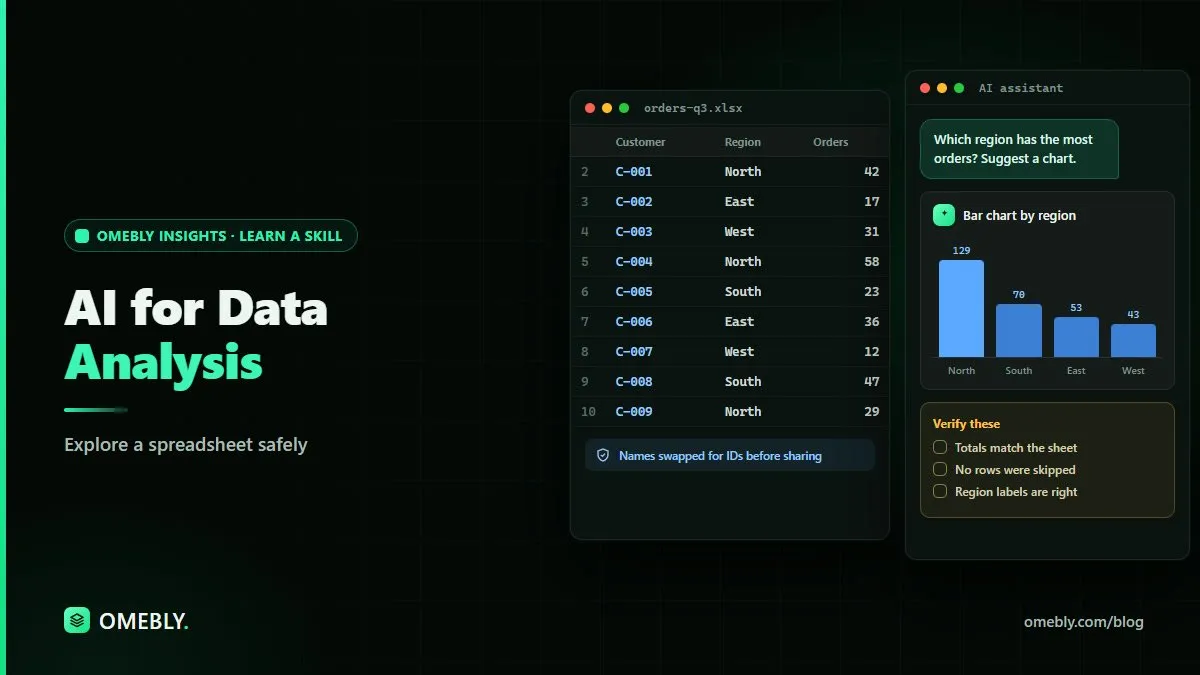
Where you need to tell records apart, replace names with codes such as C-001, C-002. Keep the lookup table that links codes to real names on your own computer, not in the AI tool.
Consider summarising first
Sometimes you don’t need to share row-level data at all. A PivotTable summary by month and region may answer the question while sharing much less.
Check the rules
Follow your organisation’s AI policy and any data protection rules that apply to you. Look at how the tool stores and uses uploaded files. If you’re unsure, ask before uploading.
Step 3: Give the AI context
A spreadsheet without context is just numbers. Start your conversation with a short brief:
“This table shows monthly online orders for a home goods shop from January to June. Columns: Order_ID (unique), Order_Date, Region, Category, Units, Revenue_USD. Customer details have been removed. I want to understand which categories and regions drove changes in revenue.”
Explaining what each column means and what you want to learn prevents many misreadings.
Step 4: Ask focused questions
Broad questions get broad answers. Work through the data in small steps.
Good questions to start with
- “Describe the structure of this data. Are there any missing values, duplicates or odd entries?”
- “Which three categories had the highest total revenue, and how did each change month to month?”
- “Are there regions where units went up but revenue went down? List them.”
- “Suggest an Excel formula to calculate average order value by region, and explain it.”
- “What chart would best show revenue by category over time, and why?”
Questions to handle with care
- “Why did sales drop in March?” The AI can only guess. Ask instead: “List possible reasons for the March drop and what data would confirm each.”
- “Predict next quarter’s sales.” Forecasts need careful method and assumptions. Treat any AI forecast as a rough idea, not a plan.
Step 5: Verify every important answer
Never put an AI-generated number in a report without checking it.
| Check | How to do it |
|---|---|
| Totals and counts | Recalculate with a PivotTable or SUM/COUNT formulas |
| Top and bottom items | Sort the data yourself and compare |
| Formulas | Test on a few rows where you know the answer |
| Surprising findings | Filter to the rows behind the result and read them |
| Steps and code | Ask the AI to show how it got the answer |
| Row counts | Confirm the AI used all the rows, not a sample |
If the AI’s figure and yours don’t match, trust your own calculation and tell the AI what you found. It will often correct itself, which is useful, but it’s also a reminder of why checking matters.
Step 6: Turn findings into clear visuals and notes
Once you’ve confirmed the findings, AI can help present them:
- Draft a short summary for a manager: three key findings, one sentence each.
- Suggest a chart for each finding; our guide on how to choose dashboard charts helps you pick the right one.
- Write clear chart titles that state the takeaway, such as “Kitchenware drove most of Q2’s revenue growth”.
Keep a note of assumptions and anything you couldn’t confirm. Honest caveats make your analysis more credible, not less.
If your findings end up in a PDF report, our free chat with PDF tool lets readers ask questions about the document, which can help when you share long reports with colleagues.
Common mistakes when using AI for data analysis
- Uploading raw data with personal details. Anonymise first, every time.
- Skipping the context. The AI misreads columns it doesn’t understand.
- Trusting confident explanations. A well-written reason isn’t evidence.
- Using one long conversation for everything. Start fresh for a new dataset to avoid mixing information.
- Not saving your work. Keep the formulas and checks you used, so you can repeat the analysis next month.
A safe workflow you can reuse
- Clean the data.
- Remove or replace personal and confidential fields.
- Brief the AI with column meanings and your goal.
- Ask focused questions, one at a time.
- Verify key numbers yourself.
- Present confirmed findings with clear charts and caveats.
How Omebly can help
If you’d like to build these skills with guidance, Omebly Academy’s AI for Data Analysis course focuses on using AI tools to work with data responsibly. It runs for 8 weeks with 16 live classes and costs USD 280. Classes are taught live by Nazmul Hussain’s team; Nazmul Hussain is Omebly’s Managing Director and Technical Head, with 10+ years of experience.
If you want deeper spreadsheet and analysis foundations, see the Data Analysis course or the Advanced Excel course. You can compare every option on the Omebly Academy training page.
Ready to explore your data faster, without cutting corners? See the AI for Data Analysis course.
Frequently asked questions
Can AI analyse an Excel spreadsheet?
Many AI tools can read an uploaded spreadsheet or pasted table, describe patterns, suggest formulas and charts, and in some cases run calculations. You should still check the results against the data yourself.
Is it safe to upload company data to an AI tool?
Only if your organisation allows it and the tool's data settings are suitable. Remove or replace personal and confidential details first, share only the columns needed, and follow any data protection rules that apply.
How do I check whether AI analysis is correct?
Recalculate key numbers with a PivotTable or formula, compare row counts and totals with the original, ask the AI to show the steps or code it used, and look at the raw rows behind any surprising result.
Will AI replace data analysts?
AI speeds up parts of analysis, such as drafting formulas, summarising patterns and suggesting charts. Defining the right question, checking data quality, judging context and explaining decisions still need a person.
Do I need to know Excel or Python to use AI for data analysis?
You can start with plain-language questions. Basic Excel skills help you check the AI's work, and Python becomes useful for larger or repeated analysis.

Written by
Nazmul Hussain, Managing Director & Technical Head, Omebly. 10+ years building websites and apps for clients in India, the Gulf, the UK and the US, and mentoring at Omebly Academy. LinkedIn · GitHub
Follow Omebly
New guides, work and launches on every channel.