Statistics for Data Analysts: The Concepts You'll Actually Use
You don't need a maths degree to analyse data well. These are the statistics concepts data analysts use every week, explained with plain examples.
Many people start learning data analysis by jumping straight into tools: spreadsheets, SQL, dashboards. That’s a good instinct, because tools are where the work happens. But sooner or later a manager asks, “Is this difference real, or just noise?” and the tool can’t answer for you. That’s where statistics for data analysts comes in.
The good news is that you don’t need a maths degree. A small set of concepts covers most of the questions analysts face. This guide explains each one in plain English, shows where it turns up in real work, and points out the mistakes that lead to wrong conclusions.
Quick answer: The statistics data analysts use most are measures of the centre (mean and median), measures of spread (range, standard deviation, percentiles), distributions, sampling, correlation, and basic hypothesis testing for comparisons such as A/B tests. Learn what each one tells you, when it misleads, and how to explain it to a non-technical reader.
Why statistics matters more than formulas
Spreadsheets and SQL calculate an average in a second. What they can’t do is tell you whether the average is the right number to report. Statistics is really about judgement:
- Which summary describes this data fairly?
- How confident can we be in this result?
- Could this pattern be chance?
- What would change our conclusion?
Think of statistics as the reasoning layer on top of your tools. If you are still building the tool layer, learn your spreadsheet and SQL basics alongside the ideas below.
1. Measures of the centre: mean, median and mode
The mean is the familiar average: add everything up and divide by the count. The median is the middle value once you sort the data. The mode is the most common value.
When the mean misleads
Imagine an online shop where most orders are small, but a handful of corporate buyers place very large orders. The mean order value gets pulled upwards by those few big orders, so it describes almost no real customer. The median tells you what a typical order looks like.
A simple rule:
- Symmetrical data (heights, test scores): the mean works well.
- Skewed data (order values, delivery times, page load times): prefer the median.
- Categories (most popular product, most common complaint type): use the mode.
When in doubt, report both the mean and the median. If they are far apart, that gap is itself a finding worth mentioning.
2. Measures of spread: how much do values vary?
Two teams can have the same average delivery time, yet one is consistent and the other is all over the place. Spread tells you which is which.
- Range: the largest value minus the smallest. Easy to explain, but one extreme value can distort it.
- Standard deviation: roughly, the typical distance of values from the mean. A small standard deviation means values cluster tightly.
- Percentiles: the value below which a given share of data falls. The 90th percentile delivery time, for example, tells you how slow the slow end gets.
- Interquartile range (IQR): the spread of the middle half of the data, from the 25th to the 75th percentile. It ignores extremes, so it’s useful for skewed data.
A practical example
If a support team reports an average response time, also show the 90th percentile. Customers remember the slow replies, not the average ones. Percentiles often tell a more honest story than a single average.
3. Distributions: the shape of your data
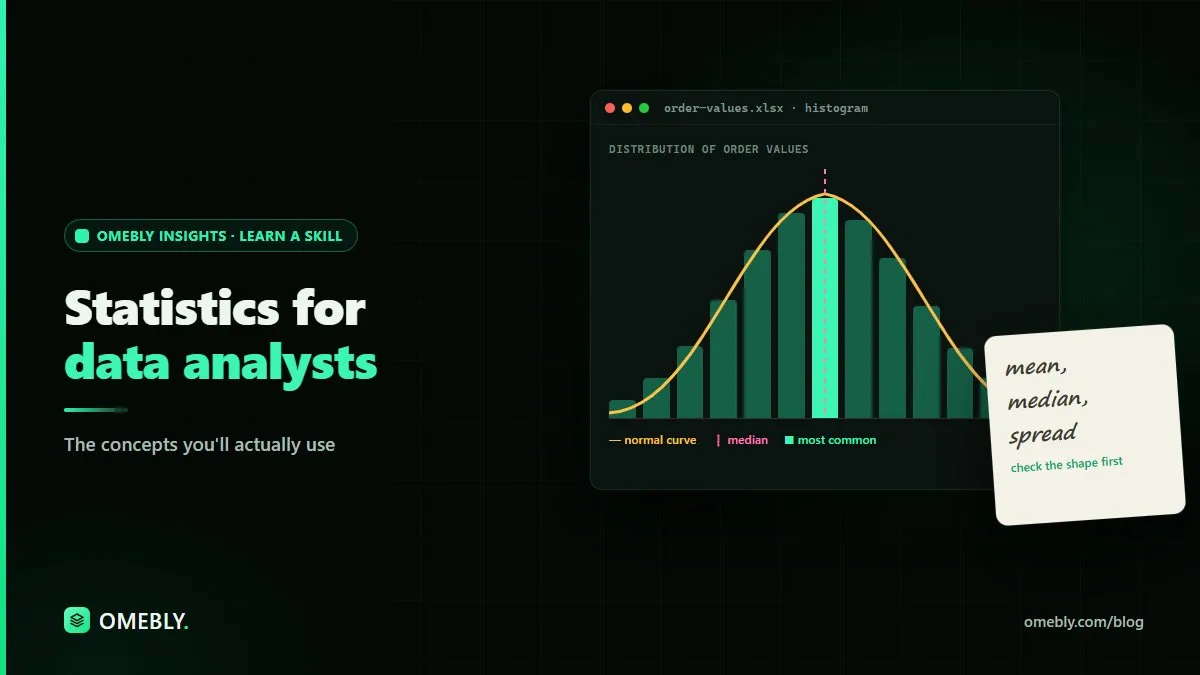
A distribution describes how often each value appears. Plotting a histogram is usually the first thing to do with a new numeric column.
Shapes you’ll see often:
- Roughly bell-shaped (normal): values cluster around the middle and tail off evenly on both sides.
- Right-skewed: most values are small, with a long tail of large values. Order values and session durations often look like this.
- Bimodal: two peaks, which usually means two different groups are mixed together, such as weekday and weekend traffic.
Seeing the shape tells you which summaries to trust. It also exposes data problems: a spike at zero or at a round number like 999 often means missing values were filled with a placeholder. Our data cleaning checklist covers how to spot and fix these before you analyse anything.
4. Outliers: investigate before you delete
An outlier is a value far from the rest. It might be a typing error, a test transaction, or a genuinely unusual but real event.
A sensible process:
- Find them. Use a box plot or flag values beyond 1.5 times the IQR from the quartiles.
- Investigate. Check the raw record. Is it a duplicate, a test, a unit mistake (grams entered as kilograms)?
- Decide and document. Fix errors, keep real events, and note what you did. If you exclude anything, say so in your report.
Never remove outliers just because they make a chart look tidier.
5. Sampling: when you can’t measure everyone
Often you work with a sample rather than the whole population: a survey of some customers, or one month of data standing in for a year.
Key ideas:
- Bias beats size. A large sample that only includes your most engaged users is still misleading. Ask who is missing.
- Bigger samples are more stable. Small samples swing wildly. A conversion rate based on a handful of visitors can jump around from day to day.
- Confidence intervals express uncertainty as a range. Saying “the conversion rate is likely between X and Y” is more honest than quoting one precise-looking figure.
6. Correlation is not causation
Correlation measures how strongly two variables move together, from -1 (perfectly opposite) through 0 (no linear relationship) to +1 (perfectly together).
It’s useful for spotting relationships worth exploring. But two metrics can move together because:
- A third factor drives both (a festival season lifts both ad spend and sales).
- It’s coincidence, especially when you compare many metrics.
- The cause runs the other way.
When you present a correlation, use careful language: “is associated with” rather than “causes”. If the decision depends on cause and effect, recommend a controlled test.
7. Hypothesis testing and A/B tests
This is where analysts answer “is this difference real?”
In an A/B test, you show version A to one group and version B to another, then compare a metric such as sign-ups. The logic:
- Start with the null hypothesis: there is no real difference.
- Collect data from both groups, assigned at random.
- Calculate a p-value: how surprising the observed difference would be if the null hypothesis were true.
- Decide using a threshold you set before the test, not after seeing the results.
Mistakes to avoid
- Stopping early the moment results look good. Decide the sample size or duration in advance.
- Confusing significance with importance. A tiny difference can be statistically significant with enough data and still not matter to the business. Always report the size of the effect.
- Testing many things at once and only reporting the winner. With enough comparisons, something will look significant by chance.
Using AI to learn and check statistics, responsibly
AI tools like Claude can be helpful study partners. You can ask one to explain a concept with an everyday example, suggest which test suits your question, or review the logic of your analysis plan. If you’re reading a long statistics guide or a research paper, our free chat with PDF tool lets you ask questions about the document as you go.
Keep a few rules in mind:
- Check every number. AI tools can make calculation mistakes or invent figures. Run the actual calculation in your spreadsheet, SQL or Python.
- Protect data. Don’t paste customer records, personal details or confidential business figures into a tool your organisation hasn’t approved. Use anonymised or sample data when asking for help.
- Verify the explanation. Confirm important concepts against a trusted textbook or course material.
- Own the conclusion. The tool can suggest; you are responsible for what goes into the report.
How to practise these concepts
Reading about statistics only gets you so far. Try this:
- Pick a public dataset with at least one numeric column and one category column.
- Plot a histogram and describe the shape in one sentence.
- Report the mean, median, standard deviation and 90th percentile, and explain which you’d show a manager and why.
- Compare two groups and write a short paragraph on whether the difference looks meaningful.
- Turn it into a small project. Our list of data analyst portfolio projects has ideas you can adapt.
Write up each step in plain language. Explaining a result clearly is as much a part of the skill as calculating it.
Learn statistics alongside the tools
Statistics makes the most sense when you apply it to real data in the same tools you’ll use at work. Omebly Academy’s Data Analysis course is taught live by Nazmul Hussain’s team. Nazmul Hussain is Omebly’s Managing Director and Technical Head, with 10+ years of experience building digital products.
If you’d like to bring AI into your analysis workflow, the AI for Data Analysis course runs for 8 weeks with 16 live classes and costs USD 280. You can compare every option on the Omebly Academy training page.
Ready to build a solid foundation? See the Data Analysis course.
Frequently asked questions
How much statistics does a data analyst need?
Most day-to-day analysis relies on a core set of ideas: averages, spread, distributions, sampling, correlation and basic hypothesis testing. Understanding these well matters more than knowing advanced formulas.
Should I use the mean or the median?
Use the median when your data has outliers or is skewed, such as order values or delivery times. Use the mean when the data is roughly symmetrical. Reporting both is often the safest choice.
What is the difference between correlation and causation?
Correlation means two values move together. Causation means one actually changes the other. Two metrics can be correlated because of a third factor or by chance, so you need a controlled test or strong reasoning before claiming cause.
What does a p-value tell me?
A p-value tells you how surprising your result would be if there were truly no difference. A small p-value suggests the difference is unlikely to be pure chance, but it does not tell you how big or how important the difference is.
Do I need to calculate statistics by hand?
No. Spreadsheets, SQL and Python do the calculations. Your role is to choose the right measure, check the data behind it and explain what the result means for the decision at hand.

Written by
Nazmul Hussain, Managing Director & Technical Head, Omebly. 10+ years building websites and apps for clients in India, the Gulf, the UK and the US, and mentoring at Omebly Academy. LinkedIn · GitHub
Follow Omebly
New guides, work and launches on every channel.